In this section we build a spreadsheet to track the inflows, outflows, and stocks of your financial resources.
The Important Thing is the Mental Model
There are plenty of apps and spreadsheet templates you can use to track all of your finances down to the last cent without having to think about it too much. We won’t be using any of those fine tools, because we are trying to err on the side of thinking about it too much (for now).
We are not merely trying to possess all of the correct data. We are trying to build an internalized mental model of the flows and stocks of one specific resource, in this case money. If you use apps or templates you will not build that mental model. It will be a form of consumption – someone else will have built an external model of your money for you, and you will merely consume that information. That is not good enough. I’m going to emphasize my point with a second and third paragraph to convey how important I think this notion is.
If you use apps or templates to complete this section, then you have not completed this section. You need to build a system for tracking your financial resources yourself, manually. (It must go without saying that asking an LLM to make a spreadsheet template for you is very, very much not completing this section.)
By manually creating this system, you will construct an internal mental model of the inflows, outflows, and stocks of your financial resources, and you will begin to cultivate an intuition for the relationship between those things, and you will be able to apply this general mental model to other resources in the future. The ability to apply the insights you get from your financial mental model to other resources is critical at other points in your journey of post-consumer praxis.
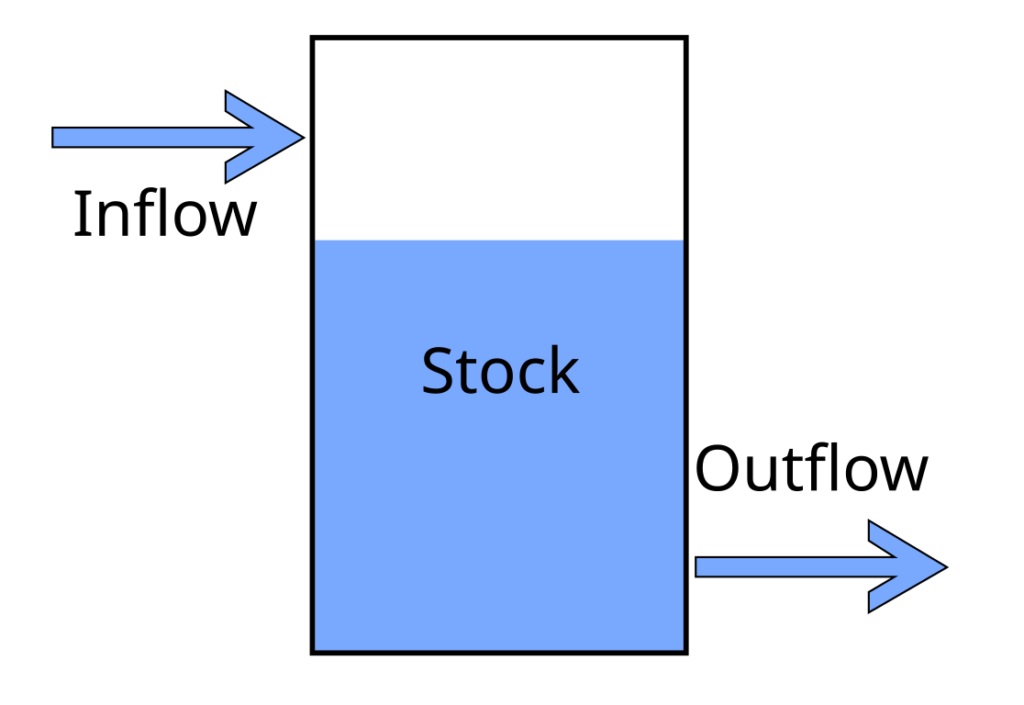
If your inflow is smaller than your outflow, your stock will decrease. If outflow is small, stock will increase. If they are the same, stock will stay the same. Think of a barrel under a spigot that you use for watering your garden. Water fills the bucket from the spigot. A hose from the barrel waters your garden. If you use more water on your garden than you put into the bucket from the spigot, the barrel will eventually empty.
Inflation is like evaporation. Over time, if you leave your money alone, it will get smaller. Keeping your money in investment vehicles is kind of like setting up a dew net: over time, the stock will increase. Investing is risky, though, so the amount can go down and up. That’s a whole topic we won’t dive into until later volumes.
If you are hardcore or hate computers you can create a tracking system on paper, but that will be so tedious you won’t want to maintain the system consistently and I don’t recommend it. Use spreadsheet software like LibreOffice Calc (alternatives include Excel or Google Sheets, they are all functionally the same). Once you become unconsciously competent at money, you will only have to interact with your spreadsheet for about 15 minutes a month.
The following is a suggested method for setting up your spreadsheet. If you have no idea how to build a spreadsheet, just follow my suggestion. If you are already a spreadsheet pro and have your own ideas for how to build your tracking system, by all means do so. If you already have a custom tracking spreadsheet that you yourself built that tracks inflows, outflows, and stocks, you’re done here.
Just so long as your spreadsheet tracks inflows, stocks, and outflows, makes sense to you, and doesn’t take much effort to maintain on a monthly basis, it is fit for purpose.
Teach Yourself How To Fish
I’m going to write directives without giving the full click by click instructions, because that would make this manual super long. You need to be able to use the internet to figure out the specific method.
For example, I’m going to tell you to sum up a specific row of data. I’m not going to tell you that the formula to sum a few cells in a row is =sum(C6:F6), or that you can probably do this by just typing “=sum” and then click-dragging the cells you want to sum and then hitting enter. I’m not going to tell you that once you enter the formula in a cell, you can just click and drag down and it will carry the formula down to the rest of the cells.
If you didn’t know that, how would you learn it?
You would open a browser and type “how do I add a row of cells in Excel.” And the internet would tell you the formula. I’m not trying to be flippant or mean by explaining this, some people haven’t habituated the process of just asking a search engine exactly what they’re trying to do. If you find yourself muttering “But HOW do I change the cell color from white to colored?!”, just type exactly those words into a search engine.
Do a search, watch youtube videos. Once you understand the few basic formulas of excel, you can make very powerful yet simple models in a spreadsheet. This is a very valuable skill to gain competence in.
(By the way, if you think that computers frustrate you and that that that is a permanent attribute of either computers or your self, you are wrong. You are frustrated at being unskilled at specific tasks with computers. Nobody truly dislikes a thing they are competent at. The solution to ‘being frustrated by computers’ is to either design a lifestyle so far outside of mainstream norms that you don’t need to use computers at all, or to intentionally develop the skills you need to use computers as a tool and not a psychological torture device. I am not naturally “good” at computers. Computers frustrate me all the time. My current day job is to become frustrated by computers when trying to do a thing, figure out whatever skill or knowledge I need to not be frustrated by the execution of that thing, and then teach that method to other people. It’s not an innate talent, it’s a process.)
How to Build It
We are going to build the minimum viable financial tracker. You will probably want to add features to it. But we’re first going to build just the minimum you need to track your financial resources.
You need one tab to track your stocks, one tab to track your flows, and one tab to summarize the other two tabs and make it easy to see everything in one place. Three tabs: Stocks, Flows, and Dashboard.
I recommend you watch the brief Tour video, and then read the rest of this section, and then watch the video again.
Stocks Tab
Open a new spreadsheet, save it, and name the first tab Stocks.
The First Column header is Date. The rest of the columns are all of your accounts, including the amount of cash in your wallet/in the shoebox under the bed. Start with all accounts outside of tax deferred retirement accounts, and then list your retirement accounts, and then list debts, and then mortgage stuff if you have one.
Stocks not in tax deferred accounts:
- Checking
- Savings
- Cash in wallet and in shoebox under the bed
- Money Market/Settlement Fund
- Brokerage Account
- CDs
- Bonds
Stocks in Deferred Accounts:
- 401k
- rIRA
- tIRA
Debts:
- CC Balance
- Auto Loan
House
- Remaining Loan Principal
- Market Value
- Equity (Market Value – Principal)
At the end of the columns of your buckets of money, create another few summary columns:
- Total Financial Resources not in deferred Accounts
- Total Financial Assets in Tax Deferred Accounts
- Total Non-Housing Debts
- NW not including moortgage or Equity
- NW Including Mortgage
- NW Including House Equity
(Right Click > Open in Separate Tab to see larger version)
I always enter debts as a negative number, and format the cells to display red. This is because I am an engineer, not an accountant. Engineers add numbers, and the sign (positive of negative) of the number dictates if the values add or subtract from each other. Accountants list everything as positive numbers, and depending on whether they are assets or liabilities, they add or subtract the numbers from each other. To me, this is confusing, so I use positive and negative numbers. You can do it however you like as long as you are consistent.
Flows Tab
Make a second tab and call it Flows. This is where we track the inflow and outflows of money. It’s the most complex tab.
There are two sections to this Tab. Up at the top are the rows where we sum inflows and outflows by month.
Below this is where we enter every transaction, every dollar that comes in and goes out.
Here’s an overview of where we’re headed:
First build the top section, section 3 in the image.
Make column E the date column, and then list out four income columns and 10-12 expense columns.
Income 1-n could be something like Job, Job2, Side Hustle, and leave any unused ones as Income#.
- Expense 1-10 should be something like:
- Food
- Shelter
- Health Insurance
- Health Care
- Education
- Transportation
- Communication (internet, phone bill)
- Pets
- Expense9 (leave the last few like this in case you want to use them later)
- Expense10
You’ll notice a few missing categories, like clothes or toiletries or electronics or utilities. The fewer categories you have, the better. You don’t need 30 different categories. Clothes and utility bills are a subcategory of Shelter and you don’t need them separated out here. You don’t need a separate category for Restaurants because you’re about to go to restaurants so infrequently it won’t matter, and it’s just ‘Food.’
Having a category for a thing makes you think you’re supposed to spend money on that thing. If you have a monthly category for “clothes” then some part of your brain thinks you’re supposed to buy clothes every month. If you have a category for “Restaurants” then a part of your brain thinks that you ought to go to restaurants every month. Why build subtle directives into your life that don’t need to be there?
On that note, you should have a category for Education. You don’t need to spend money to get an education if you have a library card, but if you spend zero dollars on education for months and months that should at least make you stop and think about your life choices. Some books aren’t available at the library. There are some courses worth paying for.
Make Section 4, which sums everything up.
To the right of expenses make summary columns for:
- Monthly Inflow (just sum all the income cells)
- YTD Inflow (Jan will just be that month’s income. February will be Feb Monthly Inflow plus Jan YTD Inflow. Pull Feb down to populate the rest of the cells).
- ttmInflow. You can’t build this until you have a year’s worth of data. If you don’t have last year’s worth of data, you can estimate it by figuring out e.g. what your total income was, dividing by 12, and entering that number in every row for the previous 12 months. Once you have real or fudged data, the ttmInflow for January 2026 is the sum of Monthly Inflow from February 2025 through January 2026.
Outflows:
- Monthly Outflow (sum all expense cells)
- YTD Outflow (Jan is that month’s outflow, Feb is Feb Outflow plus Jan YTD Outflow).
- ttmOutflow (Jan 2026 is sum of Feb 2025 through Jan 2025 Monthly Outflow)
Calcs:
- Net Monthly Flow (sum of Monthly Inflow and Outflow)
- ttmNet Flow (sum of ttmInflow and Outflow)
- ttmSR, Savings Rate. This is the percent of your income that you are not spending. It’s just ttmNetFlow/ttmInflow.
Make the Flow Recorder section, section 1 and 2
This is where you input all your transactions.
Down below sections 3 and 4, make a column header for
- Amount
- Category
- Note
- Date
Make Date be the same column as Date in Section 3. If you follow my spreadsheet, “Amount” will be column B and Date will be column E.
In columns F through T or so, you are going to make a formula that adds your flow inputs into the correct column based on the Category value. I’m going to explain this formula because it’s the most complicated formula you need.
We want to compare what you type into “Category” column to the headers in Section 3. So in section 2, each cell looks at the cell under Category and says “is this the same as the header above me?” If it is, it adds the value to that cell. If it isn’t, it keeps the cell value as zero.
Let’s build it together. I’ll describe it in words below, but it’ll be easier to watch this video where I walk through it.
Just watch the video instead of trying to follow this text
First, add an entry to row 40. Amount -$50, Category Food, Note Costco, Date March 15. Only the Amount and Category values matter, the Note and date are for your reference.
In cell F40, you want to enter the formula. Once you’ve entered the correct formula, you want to be able to drag it across to column T, and then you want to be able to drag that whole row down as far as you need. So you only need to enter this formula once, and then copy it around.
The formula is: =IF($C40=F$4,$B40,0)
In English, this formula is saying: If the value of cell C40 is equal to the value of F4, then return the value of cell B40, If C40 is NOT equal to F4, then return 0.
In this case, the value of cell F4 is Income 1 and the value of C40 is “Food”, so the formula returns zero.
What do the $ signs mean? The $C40 means “If you move this formula to the right or left, keep the reference to column C fixed.” The F$4 means “If you move this formula up or down, keep the reference to row 4 fixed.”
So, click and drag cell F40 all the way across to T40. All the values should be 0, except for cell K40, which should return -50.
Now, you can select cells F40 through T40 and drag them down several rows. As you enter values in columns B and C, the cells in columns F through T will populate.
A little housekeeping: I recommend organizing sections 1 and 2 into monthly blocks, with header rows to make it obvious.
Back up in Section 3, in the cell for the month in question under Income1, sum up all the inputs directly below it for that month. Then drag that cell across all the income and expense cells for that month. You’re now summing up all that month’s expenses.
Make a Dashboard Tab
Make a new tab called Dashboard. These cells mostly just point at cells in the other tabs, but you can add some extra computation tabs like “NW in years”.
Optional: Scrape your previous year’s data to get ttm inflow and outflow
In order to get anywhere, it is helpful to know where you are currently at. To get the trailing twelve month numbers, you need to have data going back twelve months.
The easiest way to estimate this is by figuring out how much you had in your stocks a year ago, and how much you have now. You can calculate total income over the previous twelve months and total expenses. Divide by 12 to get monthly numbers, and enter them in your spreadsheet with a note that they are estimated figures.
You could pull all your statements, dump them into a CSV file, sort and organize them, and enter all the data… but that sounds awful even to me and I like spreadsheets. Only do that if you think you’ll enjoy it. Otherwise just estimate. This does not need to be precise. Getting within a few thousand dollars is fine.
You can skip this step and just operate your spreadsheet and in twelve months you’ll have enough data to have TTM numbers.
Operation
That’s it, your Minimum Viable Tracker is complete. Here’s the Tour video again. I recommend that you operate it for several months before tweaking it too much. A few notes on operation:
- Try to update it at least once a month. If you wait longer than that it becomes daunting to catch up and you can just spend six months without updating it. My habit is to update my transactions once a week during my weekly review. This keeps the task of updating it from getting too daunting.
- The fewer transactions you make, the easier it is to update your tracker.
- If you have a month with a ton of transactions, or are trying to catch up on previous year’s data, you can export your bank transaction statements to a CSV file. Then you can open it in your spreadsheet software, clean the columns up, and paste them into the inputs. This can be the fastest way to get a lot of transactions into your Tracker. But this shouldn’t be your typical method. Typically, just open your transaction portal and manually copy the values over.
- If you make a lot of cash transactions, and thus don’t have digital records, I recommend that you keep either a notebook or a digital note in your phone for recording them. Input transactions when you make them, and transfer the information to your Tracker later.
This is Not a Budget
Note that what you have created is not a budget, but rather a tracker. Nothing in this system is telling you how much you should be spending. That is not what it is for.
The purpose of a budget is to tell you how much you can responsibly spend on any given category. A budget makes declarative statements like “Food: $500” and “Fun: $1,000” (as if exchanging money for fun is The Way to have fun lol). Note the complete lack of any such statements in this exercise.
The purpose of a budget is to establish a ceiling for your expenses. The implicit assumption of a budget is that the more you spend, the better your life is. Budgets recognize that if you overspend, eventually the consequences will catch up to you, which is why there’s a do-not-exceed amount. But budgets are a tool to get you to spend up to some amount of money. The purpose of a budget is to control your spending in such a way that you spend as much of it as possible. Budgeting is responsible consumerism.
Additionally, budgets cultivate a scarcity mindset. “You only get this much” is what budgets whisper in your ear. “This is all you get. You can go up to this line – but beyond this line you cannot go. That’s for people who make more than you and have earned the right to spend more than you, loser.” These whispers do us no good. They train us to obsess about what’s on the other side of The Line.
As aspiring post-consumers we reject these perspectives and therefore a budget is not an appropriate tool for what we are doing.
We assume that above some small threshold of spending, other factors dominate quality of life. We are not trying increase spending in the long term. We are trying to find the right balance of spending money and applying skills and strategic thinking that arrives at a material lifestyle that is perfectly sufficient for our needs, enabling and freeing us to spend our attention on things that truly matter to us and help us flourish as humans.
Therefore, we track our expenses, our income, and our stocks, so that we can wisely steward our resources, so that we can spend the vast majority of our time doing anything other than chasing the mirage of the better life on the far side of More, also known as the hedonic treadmill, also known as the bars of the invisible cage of modern life.
A purely logistical reason for not using a budget is that during the crowbar phase your cost of living will likely be dropping. You don’t currently have the information you would need to construct a reasonable budget, because you don’t know what your “natural” cost of living will shake out at once you’ve made all these lifestyle changes. Your current guesses based on your pre-Crowbar phase lifestyle are probably too high. If you set spending ceilings now, they’d either be too high because you based them on your old lifestyle, or unrealistically low because you’re just making a guess. Either way setting expense ceilings now is a waste of time. Building a system for tracking your dropping costs while building a stock and flows model of financial resources is not a waste of time, and will serve you well in the future.
FAQ
Q: But apps will do all this automatically. This is a waste of time.
A: This is not a waste of time. Having the data is only part of the point. We’re trying to change our brains here. There is no app for that. There is a cognitive rewiring benefit to doing this manually. Yes it’s harder. Changing your brain is hard. If it didn’t take some effort, it wouldn’t be changing your brain. Good general advice is to be suspicious of anything that is easy. It might be a waste of time.
By building a spreadsheet that tracks the inflows, outflows, and stocks of money, you are training your brain to think in terms of inflows, outflows, and stocks. Build and operate this spreadsheet consistently for a period of time and you will ‘magically’ think much more intuitively about your money situation.
Q: Can you post your spreadsheet so I can copy it?
A: No. See the answer to the previous question. If you don’t build it yourself you won’t understand it as well and you won’t have as good of a mental model.
Q: What about tracking all of my different investments?
A: We’ll get to that later.
Q: I have debt.
A: Been there. You got this.
Q: Right but how?
A: As your COL drops, save up 1-3months of living expenses, and then everything else goes to paying off debt. While you still have debt, do not undertake any capital intensive projects like a tiny house build (unless you’re getting all the materials for free). Only spend money on absolute necessities and dump everything else into debt payments.
Depending on your wiring, it might be worth it to set up certain rituals or practices around paying off your debt. For example, I really enjoyed making a chart that showed my debt dropping month over month, and estimated when I would hit zero debt. Updating the principal debt amounts after making a payment gave me a psychological reward. You might prefer to pull a hot bath and make your favorite meal when you make your debt payments. Do not go out to a restaurant as a ‘reward’ for making a debt payment. This kind of thinking is a form of psychogical cruelty foisted upon us by consumerism, the ideological system that the elite use to pacify and harness our life energies for their own purposes.
Leave a Reply